Pre-Class Reading
So far we have discussed how we can build models to explore the relationship between two or more variables. It is possible that when you add in a new covariate to your model, that the significance of your main association of interest changes. When that happens, it suggests that you may have found a confounding variable. A confounding variable is one that influences both the explanatory variable and the response variable.
Let’s explore a conceptual example of confounding.
Fire Damage
The scatterplot below illustrates how the number of firefighters sent to fires (X) is related to the amount of damage caused by fires (Y) in a certain city.
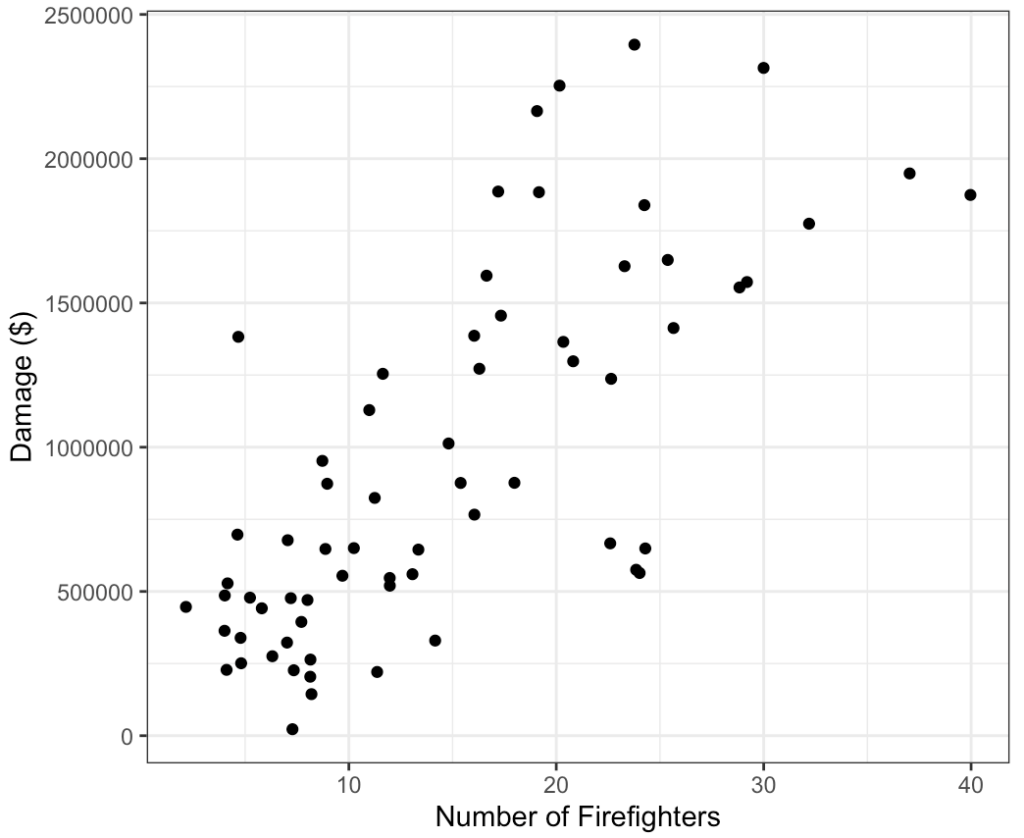
The scatterplot clearly displays a fairly strong positive relationship between the two variables. Would it, then, be reasonable to conclude that sending more firefighters to a fire causes more damage, or that the city should send fewer firefighters to a fire in order to decrease the amount of damage done by the fire? Of course not! So what is going on here?
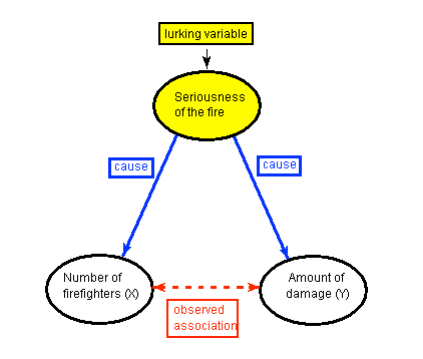
There is a third variable in the background—the seriousness of the fire (ranging from 0 (mild) to 5(severe))—that is responsible for the observed relationship. More serious fires require more firefighters and also cause more damage.
The following figure will help you visualize this situation:
Visually, if we graphed the data and included seriousness of the fire, you would observe:
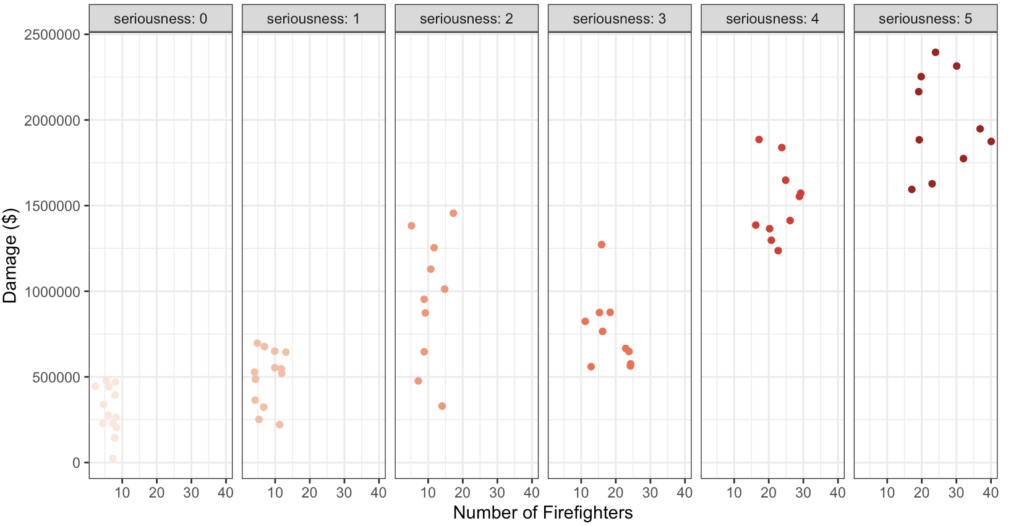
Notice that when we look within each panel (that is, each level of seriousness of fire), that there does not appear to be any visible relationship between number of fire fighters and damage.
Here, the seriousness of the fire is a confounding variable. In statistics, a confounding variable (also confounding factor, lurking variable, a confound, or confounder) is an extraneous variable that is associated (positively or negatively) with both the explanatory variable and response variable. We need to “control for” these factors to avoid incorrectly believing that the response variable is associated with the explanatory variable.
In practice, confounding variables might not be this easy to detect. Therefore, we might have started by testing our main association of interest: number of fire fighters and damage of fire. That is, let’s start with a simple linear regression with damage as our response variable and number of fire fighters as our explanatory variable.
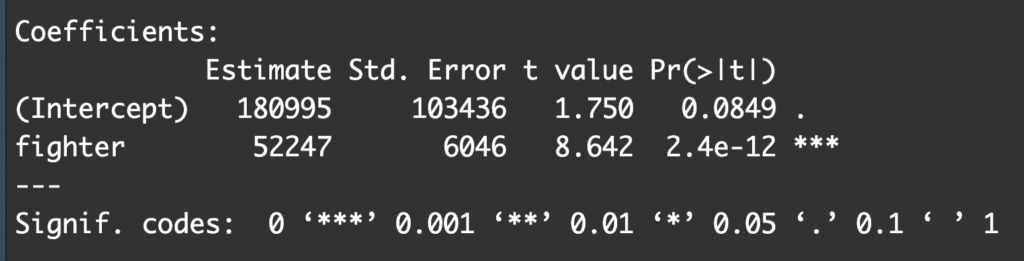
The output tells us that there is a significant and positive association between number of fire fighters sent to a fire and damage (B=52247, p<0.001). Specifically, our model estimates that for each additional fire fighter sent, the associated damage is expected to increase by $52,247 on average.
We just discussed that there is strong reason to believe that the only reason these two variables are associated with one another is because both of them are related to seriousness of the fire (a score ranging from 1 (mild) to 5 (severe)). If this is our concern, we might want to control for seriousness of the fire in our model and determine whether number of fire fighters is still significantly associated with damage. Therefore, we now run a model that includes both number of fire fighters and seriousness of fire as predictors of damage.
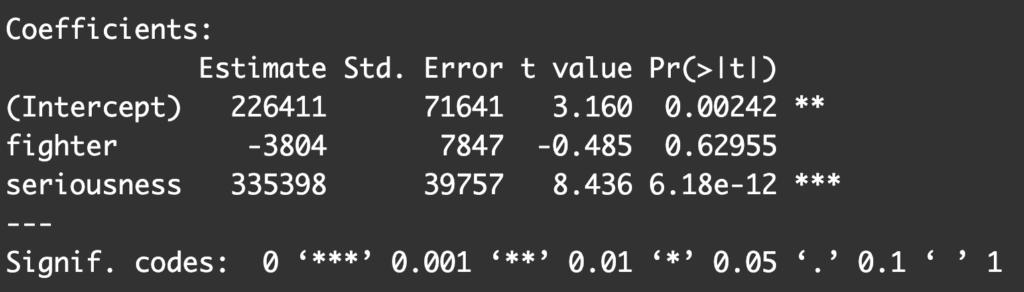
Our output demonstrates that when we include seriousness of the fire in the model there is no longer a significant relationship between number of fire fighters and damage (B=-3804, p=0.6296). This suggests that seriousness of the fire confounds the relationship between number of fire fighters and damage.
Confounding is a major threat to the validity of inferences made about statistical associations. In the case of a confounding variable, the observed association with the response variable should be attributed to the confounder rather than the explanatory variable. In science, we test for confounders by including them in our statistical models. If our association of interest is significant even after controlling for potential confounders, then we are closer to understanding whether there may be causal link between our explanatory and response variable (that does not mean there is a causal link).
Pre-Class Quiz
After reviewing the material above, take Quiz 14 in moodle. Please note that you have 2 attempts for this quiz and the higher grade prevails.
During-Class Tasks
Work on Mini-Assignment 11 and Project Component L.