Pre-Class Reading
Logistic regression will allow us to build a model when there is a categorical response variable with two levels. Logistic regression is a type of generalized linear model (GLM) where we will aim to use a collection of explanatory variables to help us make predictions about the probability of a particular level of the response variable.
Logistic regression can be used in the following scenarios:
- We are interested in the relationship between candidate success in an election and campaign contributions. That is, we want to know how or whether the amount of money fundraised (the explanatory variable), helps us predict the success of the election (the response variable). Notice that the response variable is categorical with two levels (win=1, lose=0).
- The NIH is interested in studying the relationship between alcohol behaviors and the development of HIV for individuals who do not have HIV at the beginning of the study period. Notice that the response variable here is the development of HIV (yes=1, no=0).
- School districts want to study how test scores, demographics, and counseling are related to a high school senior’s choice to go to college. Here we want to know how test scores, demographics, and counseling (our collection of explanatory variables), helps us predict whether a student chooses to attend college (college=1, no college=0).
Notice that just like multiple linear regression, we can utilize many explanatory variables. It is the nature of the response variable which will inform you of what type of regression is appropriate.
Before we discuss the mechanics of logistic regression, let’s begin by some of the terminology we will be seeing through the example below.
Example: Vitamin C
Does taking Vitamin C help prevent colds? Researchers want to study the relationship between daily ingestion of Vitamin C tablets and whether the person developed at least one cold over the winter season. Approximately half of the participants were randomly assigned to the Vitamin C group and the remaining participants were assigned to the Placebo group. The response variable is whether or not a cold developed. The results are summarized below:
| Outcome | |||
| Cold | No Cold | Totals | |
| Placebo | 335 | 76 | 411 |
| Vitamin C | 302 | 105 | 407 |
| Totals | 637 | 181 | 818 |
We are interested in whether Vitamin C helps people avoid colds. There are a few quantities that can help us here.
- The probability that a person in the placebo group developed a cold is 335/411=0.815
- The odds of an event is the ratio that compares the probability of the event happening against the probability of the event not happening. That is, the odds that a person in the placebo group develops a cold is 0.815/(1-0.815)=4.4. This quantity means that it is 4.4 times more likely for a person in the placebo group to develop a cold than it is for them to not develop a cold.
- The probability that a person in the Vitamin C group developed a cold is 302/407=0.742
- The odds that a person in the Vitamin C group developed a cold is 0.742/(1-0.742)=2.9. This quantity means that it is 2.9 times more likely for a person in the Vitamin C group to develop a cold than it is for them to not develop a cold.
- What we really care about is comparing the probability of a cold for the Placebo group and for the Vitamin C group. There are several ways to do this. But the way that helps prepare us for logistic regression is if we examine the odds ratio. This quantity is the ratio of the odds of an event for one group with the odds of an event for another group. For our example, the odds ratio will compare the odds of a cold for the Placebo group with the odds of a cold for the Vitamin C group.
- The odds ratio is 4.4/2.9=1.5. That is, the odds of a cold developing is 1.5 times higher for the Placebo Group than it is for the vitamin C group.
In general, we have the following formulae:
The odds of an event: P(Event happens)/P(Event does not happen)
The odds ratio between two groups: Odds of event for group A/Odds of event for group B
- If the odds ratio equals 1, then the odds of an event are the same between group A and group B. That is, the probability between the two groups for event to occur is the same.
- If the odds ratio is less than 1, then the odds of an event are smaller for group A than they are for group B. That is, the probability of an event happening is less likely for group A than it is for group B.
- If the odds ratio is greater than 1, then the odds of an event are greater for group A than they are for group B. That is, the probability of an event happening is more likely for group A than it is for group B.
Logistic Regression
Suppose we take a random sample of candidates running for office at the local level. We want to know if there is a relationship between candidate success and the amount of money (in thousands of dollars) they were able to raise.
The logistic regression model relates the probability a candidate wins the election (pi) to the predictor campaign contributions (X), through a framework that is similar to that of multiple linear regression:
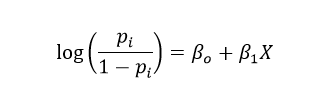
The transformation on the left side of the equation was necessary so that the range of possible values on the left (which includes all real numbers) can include all of the possible values that could be generated on the right hand side of the equation (which also includes all real numbers).
While the model above is less intuitive than the model we use for multiple linear regression, there are many similarities you will notice once we use software to get our estimates for the regression coefficients (in this case B0 and B1).
Let’s suppose that using the appropriate syntax we obtain the following computer output:
| Term | Estimate | Std. Error | z-value | Pr(>z) |
| (Intercept) | -0.8362 | 0.0962 | -8.69 | 0.000 |
| CampaignMoney | 0.02787 | 0.0123 | 2.27 | 0.0231 |
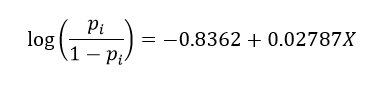
What this model is generally telling us is that campagin contributions is significantly (and positively) associated with the likelihood of a candidate being elected (B1=0.02787, p-value=0.0231).
Let us examine how we could write out the regression equation:
We can use this model for predictions as well. Suppose that we have a candidate who was able to raise 100 thousand dollars. What is the probability that they will win their local election?
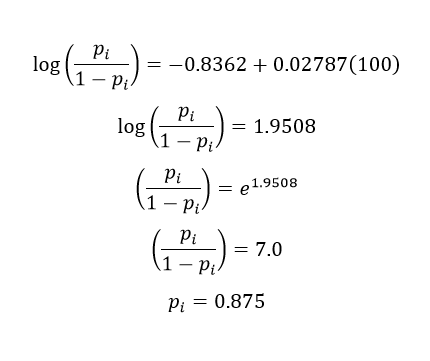
There are a few quantities here that are informative. First, the odds of this candidate winning the election is 7.0. That is, they are 7 times more likely to win then they are not to win. Secondly, we may just want to state that the probability of winning is 0.875. The point of showing you this algebraically is just so you know that we can use this equation to make probability predictions of an event happening.
What if we want to interpret the slope coefficient? As with multiple linear regression we can say as X increases by a unit of 1 the quantity on the left hand side increaese by B1 units. That is to say, as X increases by 1 unit, the log odds increase by B1 units. Nobody likes log odds! We’d rather know how the actually odds are changing as X increases by 1 unit. As X increases by 1, the odds change by a multiplicative factor of eB1. For those of you interested in why that is the case, you can look at the algebra involved here.
For this example, as the campaign contributions increase by 1 thousand dollars, the odds of winning the election increase by a factor of 1.03. That is, it is more likely that a candidate will win the election as the contributions increase.
Please refer to the translation syntax for the coding that corresponds to this content.
There are some additional interpretations of logistic regression models available here. It may be helpful to review if you have a categorical explanatory variable that is more than 2 levels in your project.
Pre-Class Quiz
After reviewing the material above, take Quiz 12 in moodle. Please note that you have 2 attempts for this quiz and the higher grade prevails.This is your last quiz for the course!
During-Class Task
Work on Mini-Assignment 9 on Logistic Regression and Project Component J.